Rethinking Industrial Dashboards: Why CAD Belongs in Observability and Analytics Platforms
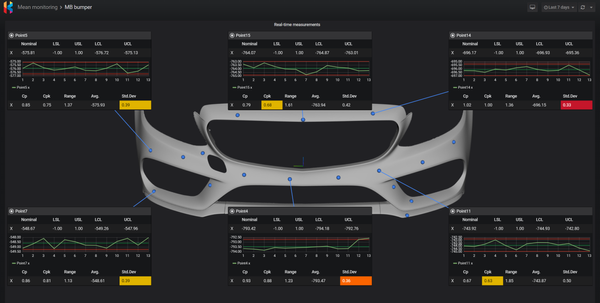
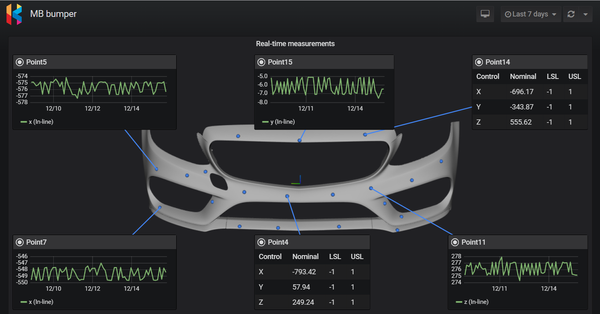
Last week we released the SPC CAD Panel, a free, open-source Grafana plugin that lets you visualize measurement data directly on 3D CAD models. You can find the documentation here and the GitHub repository here.
Part of a Growing SPC Toolkit for Grafana
The SPC CAD Panel is the third open-source plugin we've released for statistical process control in Grafana. Together, they give you a complete set of tools for quality analysis:
SPC Chart Panel — Control charts for monitoring process stability over time. Supports Xbar-R, Xbar-S, and XmR charts with automatic calculation of control limits. If you're tracking whether a process is staying in control, this is your starting point.
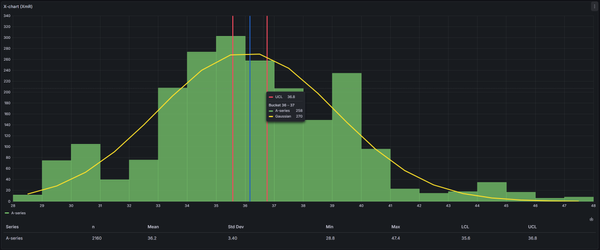
SPC Histogram Panel — Distribution analysis with histograms, bell curves, and a built-in statistics table showing Cp, Cpk, Pp, and Ppk. Use it to understand process capability: is your process producing results within specification limits?
SPC CAD Panel — The new one. Brings 3D geometry into the picture, letting you bind the data from control charts and histograms to physical features on your parts.
The three panels work together. You might have a dashboard where the CAD panel shows your part with color-coded features, and clicking a feature opens an annotation with an SPC chart showing its measurement history. The geometry gives you context; the charts give you the statistical analysis.
The Problem: Manufacturing Data is Spatial, Dashboards Are Not
Every measurement in manufacturing comes from somewhere physical. A diameter measurement comes from a specific hole. A surface roughness reading comes from a specific face. A temperature sensor sits at a specific location on a machine.
Yet when we visualize this data, we strip away all that spatial context. We end up with charts, tables, KPIs, and time series — all useful, but all flat. The geometry disappears.
This creates real friction in daily work. When you're investigating a tolerance issue, you have the measurement data in one system and the CAD model in another, mentally mapping between them. When you're explaining a quality problem to someone from another department, you're pointing at a chart and saying "this is the feature near the top left, the smaller hole, no the other one."
The system knows the geometry. The engineers know the geometry. The dashboards don't.
The Solution: Put the Data Where It Came From
The SPC CAD Panel brings 3D CAD models directly into Grafana dashboards and lets you bind live data to physical features. Instead of navigating between charts and mentally reconstructing which measurement belongs to which feature, you navigate the part itself. Click on a feature, see its data. The geometry becomes the interface.
The plugin supports STL, 3MF, and PLY files, plus ASC point cloud data for scan comparisons. You can upload models up to 5MB directly into the panel, or reference a URL to load larger models up to 200MB. All formats support gzip compression for faster loading.
Starting April 1, our commercial SPC CAD Data Source plugin will also support direct uploads up to 200MB.
What You Can Actually Do With It
Once your CAD model is loaded and connected to your data, you can:
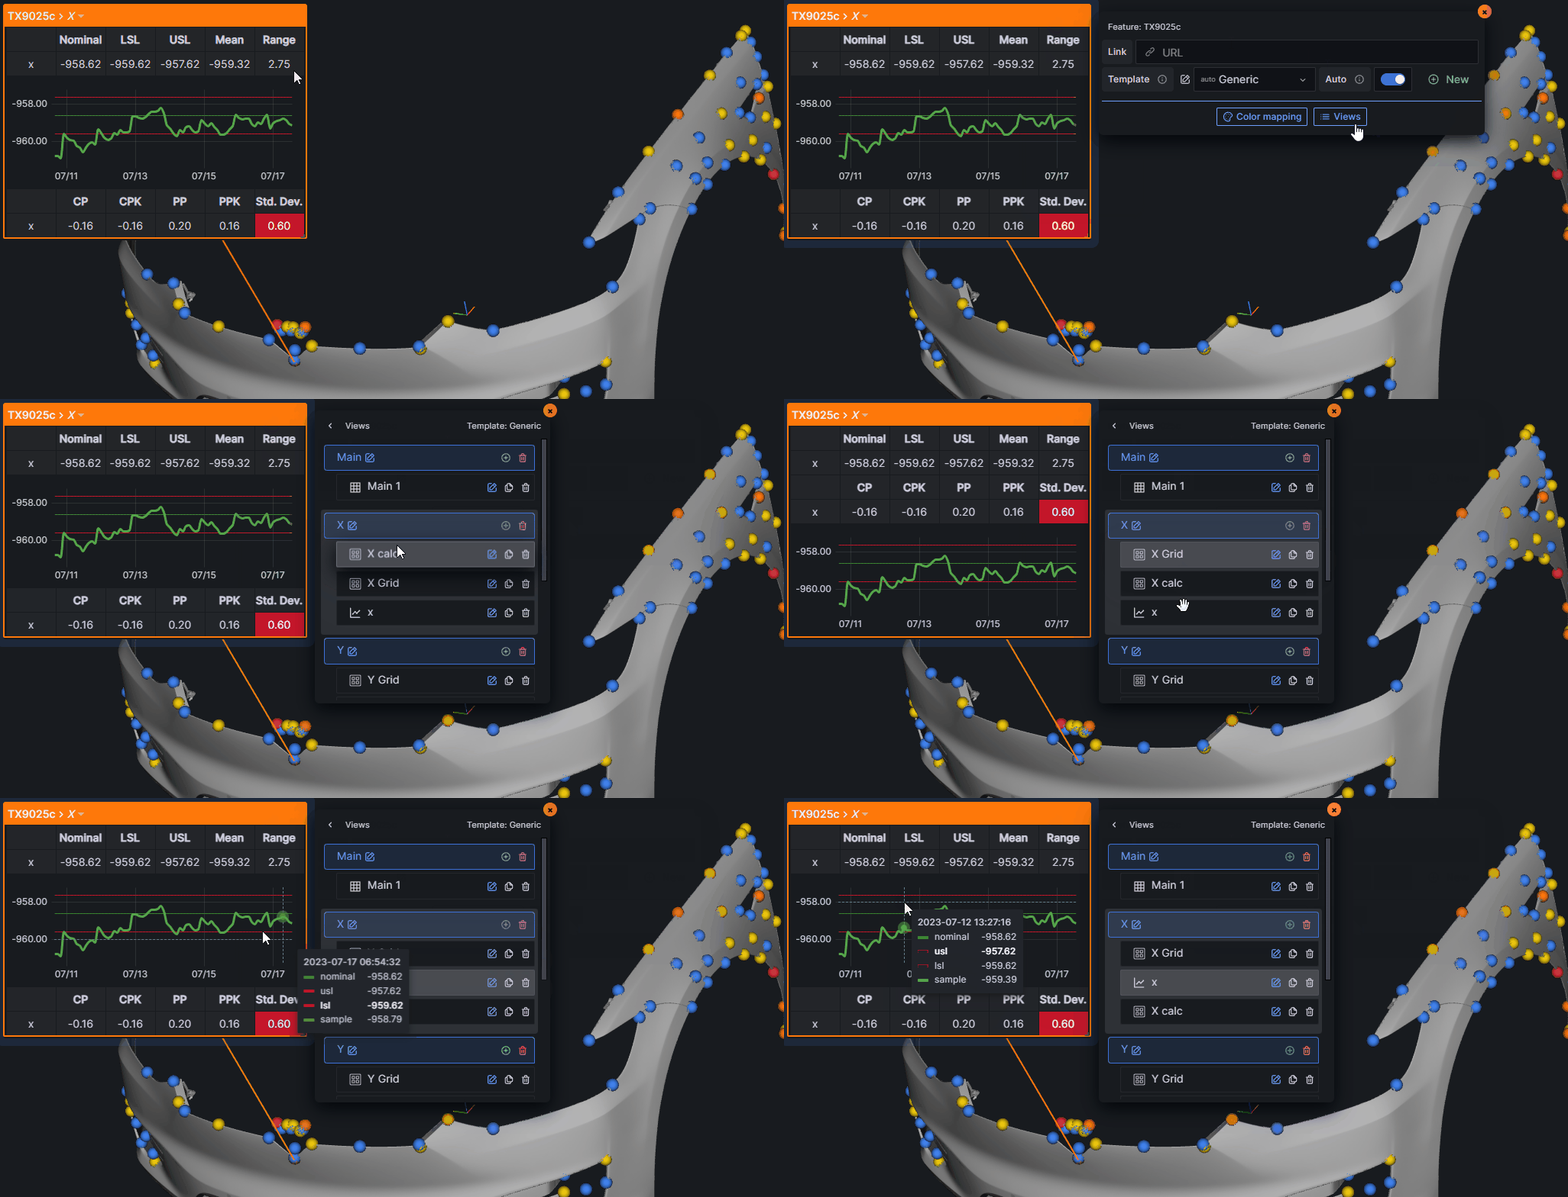
- Click any feature to see its annotation — a panel showing measurements, tolerances, charts, or whatever data you've configured
- Color-code features based on live data — set up rules so features turn green, yellow, or red based on pass/fail status, deviation from nominal, or any column in your data
- View SPC charts in spatial context — click a hole, see its diameter trending over the last 500 parts, with control limits and forecasting if you have that configured
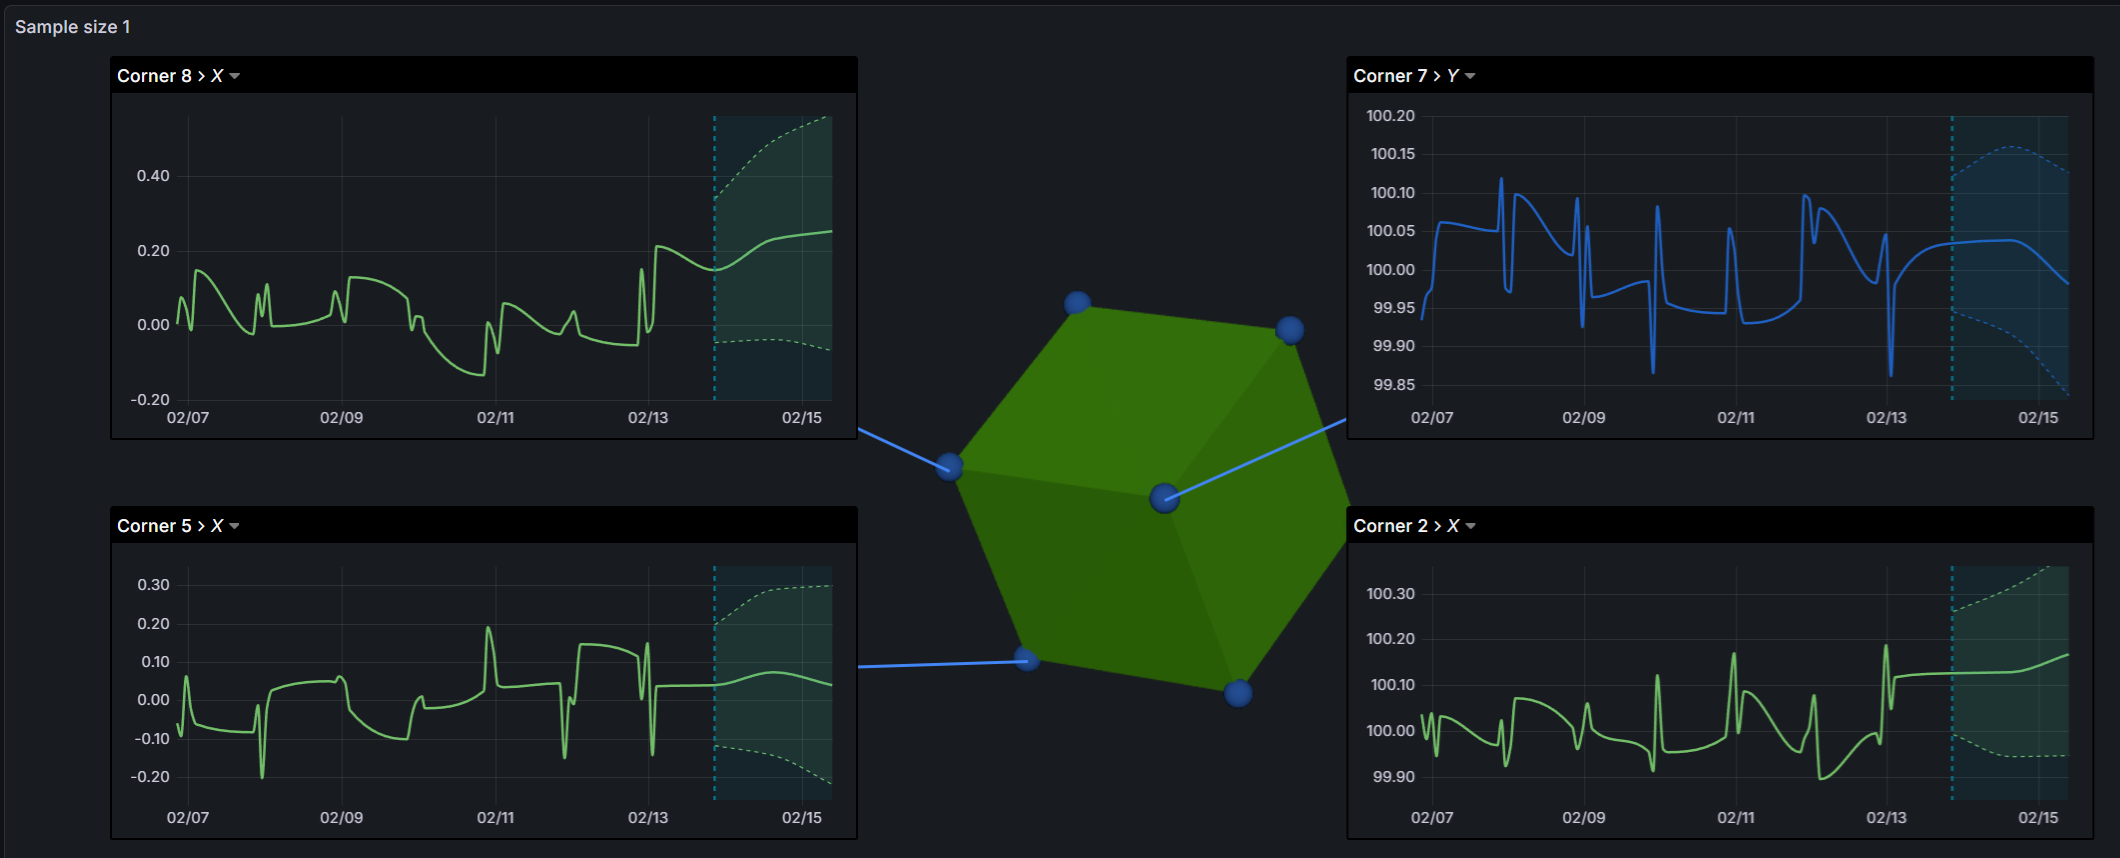
- Animate through scan history — load point cloud scans from different times and scrub through them on a timeline to see how a part or tool changed
- See deviation data as color gradients on point clouds — blue for negative deviation, green for nominal, red for positive, all mapped automatically
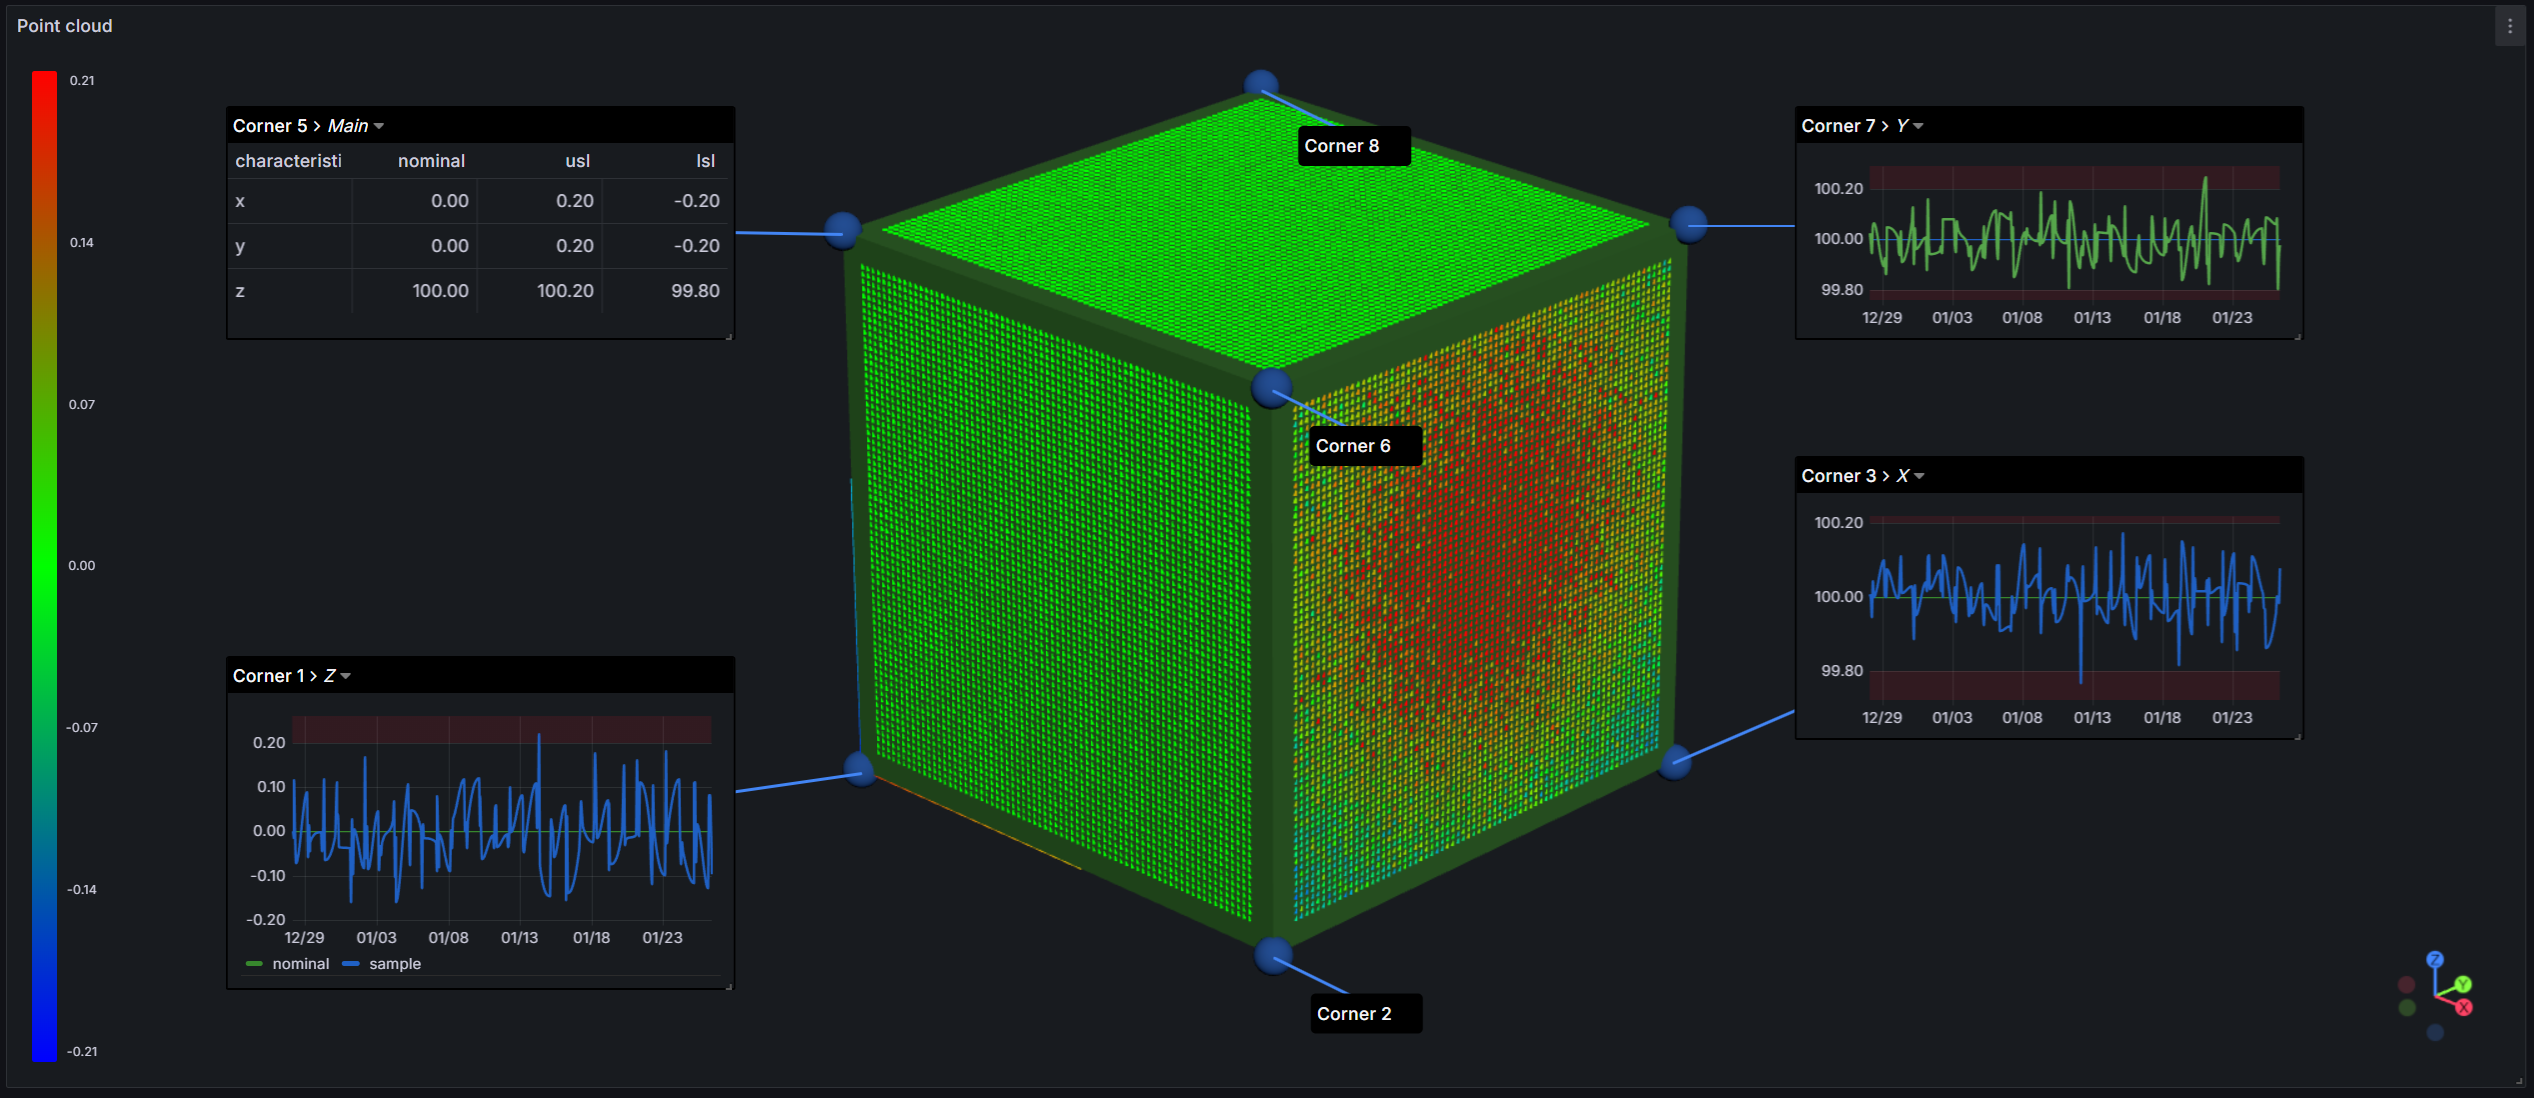
The annotation system is flexible. Each feature can have multiple views with tables, time series charts, and custom grid layouts. There are 13 built-in templates for common feature types (holes, cylinders, planes, etc.), or you can build your own.
Use Cases
Quality Engineering
- Click on a hole feature, see its diameter measurements trending over the last 500 parts
- Spot which features are drifting out of tolerance — they turn red right on the model
- When something fails inspection, see exactly where on the part it happened without cross-referencing spreadsheets
Manufacturing Operations
- Bind temperature or vibration sensors to the actual machine geometry — see hot spots, not just numbers
- When a fault occurs, see which physical area of the machine triggered it
- Compare scan data from this morning to last week, animated on the same model
Digital Twins
- Your CAD model becomes the interface — click anywhere to access live or historical data
- No more separate systems for "the model" and "the data"
- Start with geometry you already have (STL, 3MF), connect it to measurements you're already collecting
Why Grafana?
If you're not familiar with Grafana, it's an open-source analytics and visualization platform. It connects to almost any data source — SQL databases, time series databases, REST APIs, CSV files, and more — and lets you build dashboards combining data from multiple sources.
For manufacturing, this matters because your measurement data probably lives in multiple places: a quality database here, a historian there, maybe some CSV exports from coordinate measuring machines. Grafana can pull from all of them without requiring you to consolidate everything into one system first.
The SPC CAD Panel extends Grafana into 3D space. Your existing queries, your existing data sources, your existing dashboards — now you can add a panel where the visualization is the actual part geometry.
Why Open Source?
We believe industrial analytics infrastructure should be composable and extensible, not locked into proprietary ecosystems. The plugin is released under the GNU Affero General Public License v3.0.
If you find bugs, want features, or want to contribute, the GitHub repo is here. We also have a Discord community if you want to ask questions or share what you're building.
Getting Started
- Install the plugin in your Grafana instance
- Add a CAD model (upload a file or provide a URL)
- Configure a query that returns feature data with at least: feature name, characteristic ID, and nominal value
- Click on features in the 3D view to create annotations
The documentation has detailed setup instructions, data model requirements, and examples.
We'd love to see what you build with it.


