SPC Rethinking Industrial Dashboards: Why CAD Belongs in Observability and Analytics Platforms 5 months ago • 5 min read
Industry 4.0 Machine Learning and Statistical Process Control (SPC) in Manufacturing 3 years ago • 3 min read
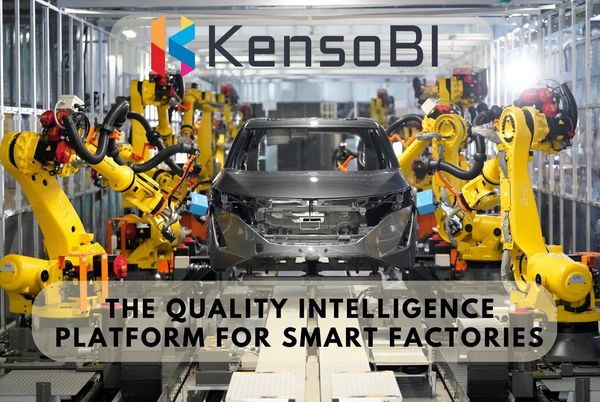
KensoBI KensoBI is the ultimate quality intelligence platform for smart factories. 3 years ago • 2 min read
KensoBI Join the KensoBI 2.0 Closed Beta Program Today and Help Us Shape the Future of Manufacturing Business Intelligence! 3 years ago • 1 min read