Three Minitab features that work better on live data
SPC practice is usually divided into two stages:
- Phase I (retrospective): analyze historical data, remove assignable causes, estimate parameters and establish control limits.
- Phase II (monitoring): freeze those limits and compare new measurements against them as they arrive.
Minitab fits Phase I well. An engineer can load a worksheet, compare estimators, remove known special causes and establish defensible limits. Phase II is more time-sensitive. If data must be exported, loaded and analyzed again, a process shift may run for hours before anyone sees it.
SPC Chart PRO runs as a Grafana panel. It reads measurements directly from the dashboard data source and recalculates on each refresh. The methods are familiar to Minitab users. The main difference is when the result becomes available.
Special-cause testing
Minitab and SPC Chart PRO both implement eight tests for special causes. SPC Chart PRO calls them run rules, but the numbering matches. Minitab test 2 is rule 2 in the panel.
Rule 2 detects nine consecutive points on the same side of the center line. If a process is sampled every 10 minutes and its mean shifts at 08:00, the ninth point arrives at about 09:20. SPC Chart PRO can flag it on the next dashboard refresh, change its color and identify the violated rule in the tooltip.
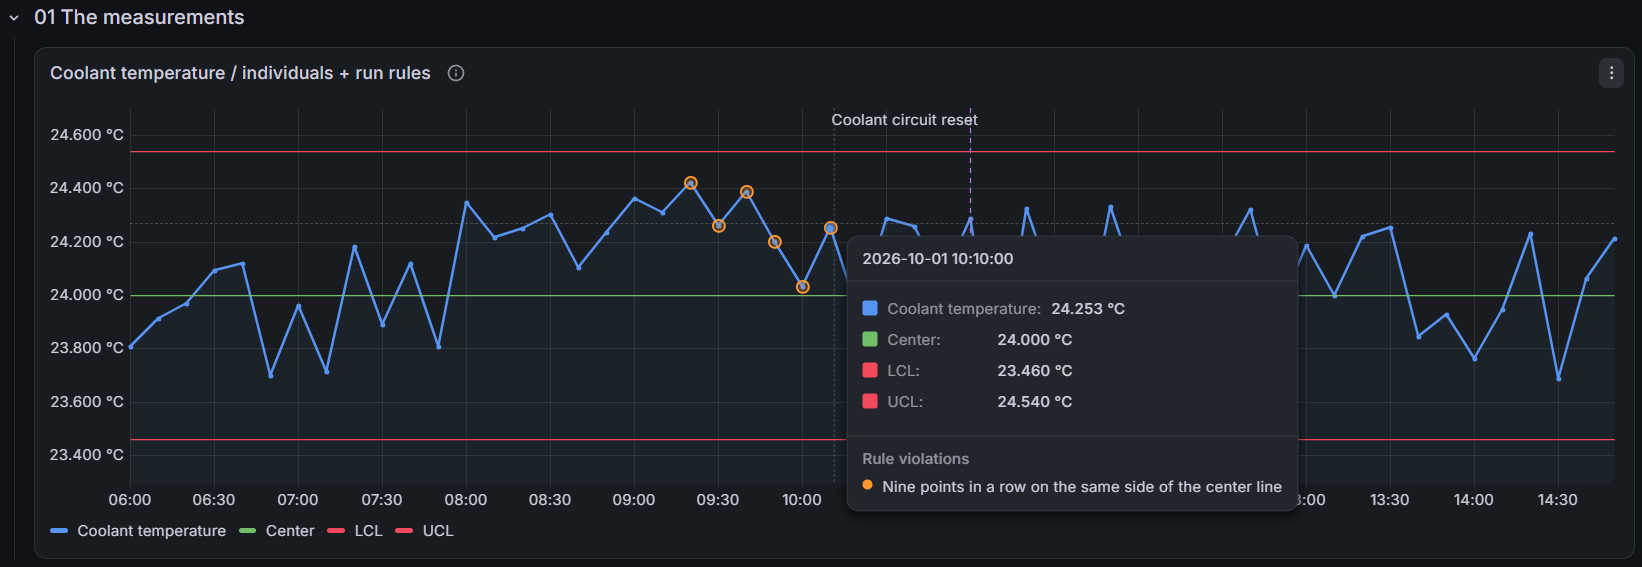
Minitab detects the same pattern when the analysis is run. Its Session window lists the affected subgroups, which then have to be traced back to the process conditions at the time.
SPC Chart PRO enables rules 1 and 2 by default. The others can be enabled individually. After a known process change, a new stage can begin at the first good point so earlier violations do not carry into the new period. CSV exports also include detected violations.
EWMA and CUSUM
EWMA and CUSUM are designed to detect small, sustained shifts sooner than a conventional Shewhart chart.
On an individuals chart using only a 3σ limit test, a one-standard-deviation shift has an average run length of roughly 44 points. A CUSUM with k = 0.5 and h = 4, the SPC Chart PRO defaults, detects the same shift in about eight points on average.
At one measurement every 10 minutes, that is roughly seven hours versus 80 minutes. That advantage matters most when the chart is live. A CUSUM run against last week's data can show when the process shifted, but it cannot shorten the response time.
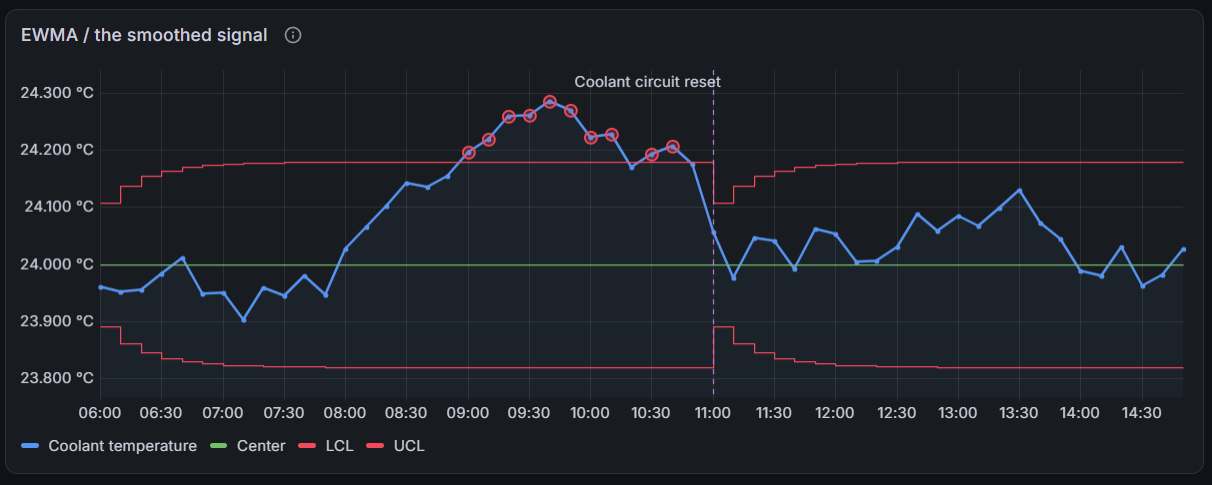
SPC Chart PRO exposes the standard parameters for both methods. EWMA uses weight λ and limit width L. CUSUM uses reference value k and decision interval h. Both can use a supplied historical mean and σ.
CUSUM also supports fast initial response, which starts the cumulative sums at half the decision interval. This increases sensitivity immediately after a restart or changeover.
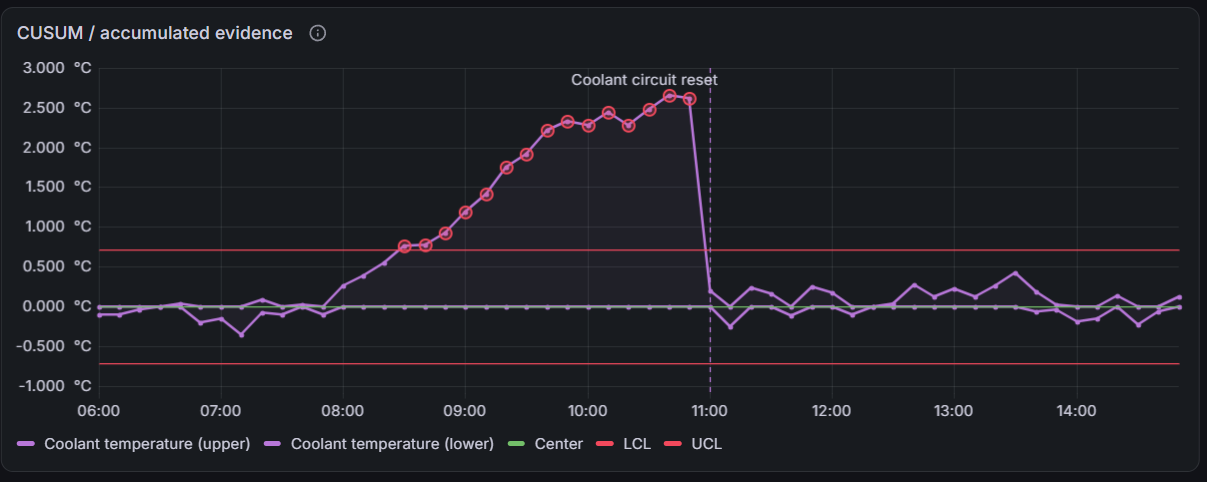
Only rule 1 is available on EWMA and CUSUM charts because each plotted point already incorporates previous observations.
Control limits by product or machine
Phase II normally uses fixed limits established during Phase I. Minitab supports this through its Parameters settings, where an engineer can enter a historical mean and standard deviation.
That works well for a single analysis. It becomes harder to manage when limits vary by product, machine or characteristic. Steel on machine 1 may require different parameters than aluminium on machine 2, and those values have to be selected correctly each time.
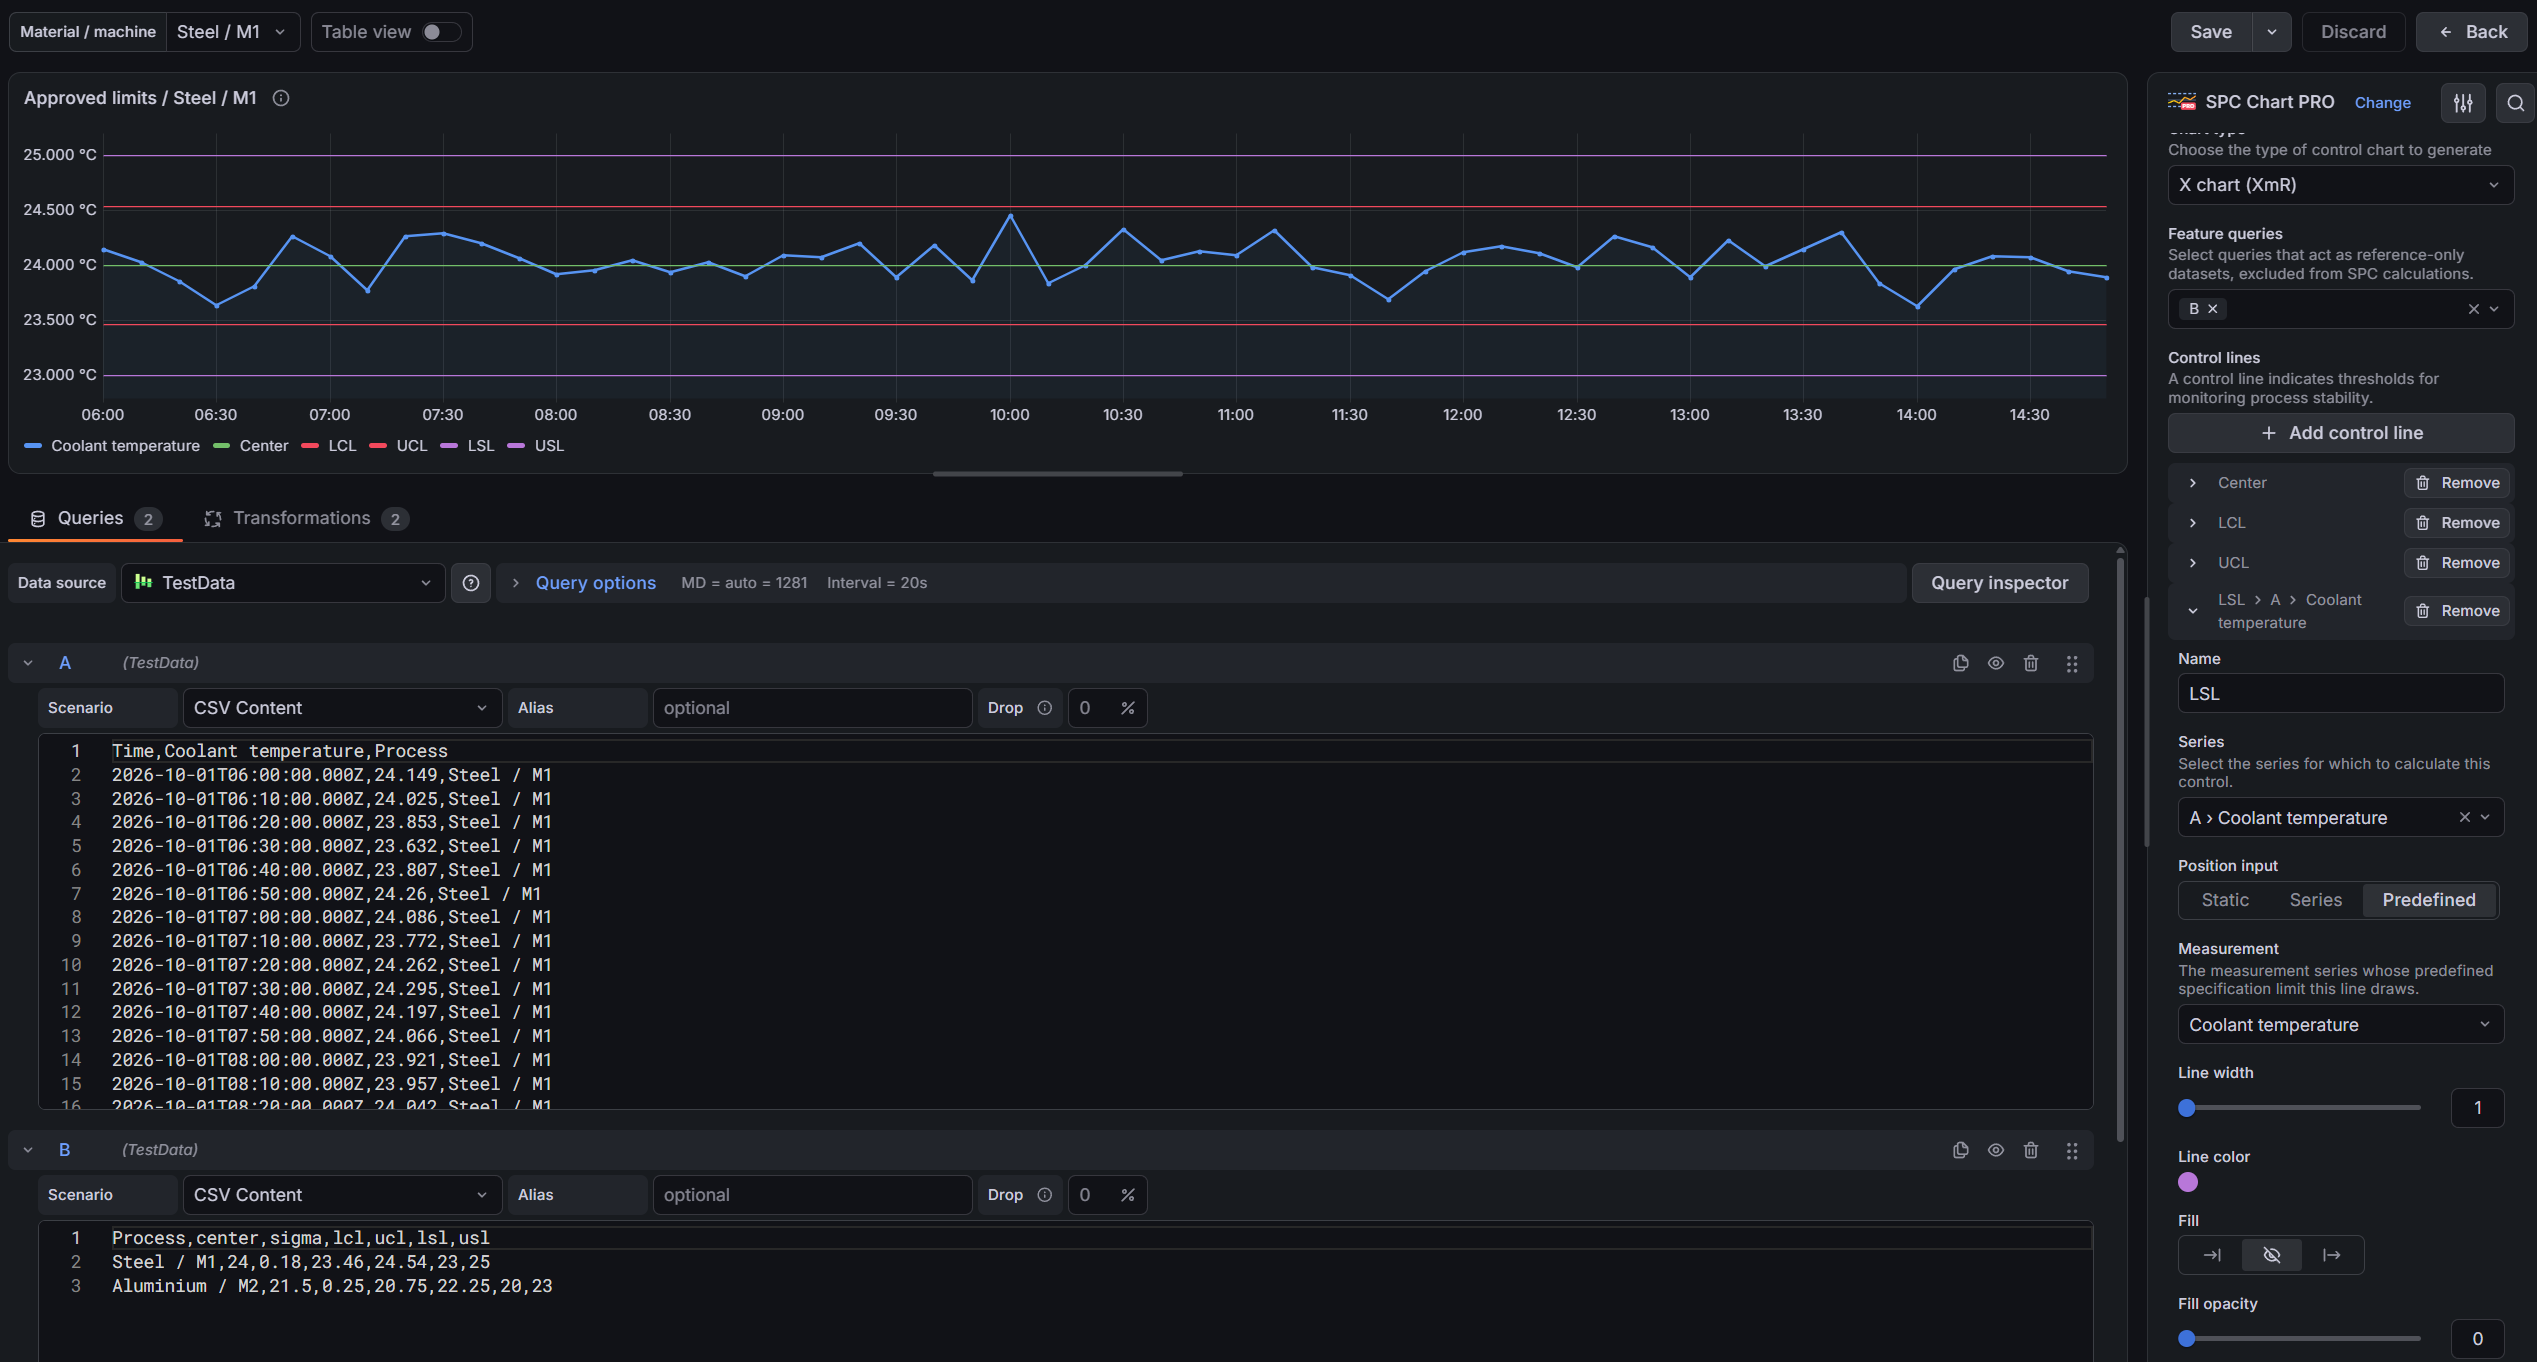
SPC Chart PRO can read approved parameters directly from a database. With Calculation set to Predefined parameters, each series can be mapped to its center value and σ. LCL, UCL, LSL and USL can also come from fixed values or query fields.
Grafana variables provide the process context. Selecting Steel / M1, for example, can return both the measurements and the approved parameters for that combination. If quality updates the limits in the source table, the dashboard uses the new values on its next refresh.
Handling missing parameters
SPC Chart PRO does not estimate replacement limits when predefined parameters are missing. The series is plotted without control limits, making the missing configuration visible.
Rule 1 can evaluate against the supplied LCL and UCL or center ± 3σ. For subgroup charts, the configuration also specifies whether σ represents individual measurements or subgroup means.
Predefined parameters are available on individuals and Xbar charts, with separate values for each series.
SPC Chart PRO is available through the Grafana plugin catalog. Download the plugin and try these features with your own process data.