Prediction Control Charts (PCC): AI-infused SPC charts
At its core, Prediction Control Charts (PCC) leverage the power of machine learning and predictive analytics to monitor and control manufacturing processes. Unlike traditional SPC charts that rely solely on historical data to detect deviations, PCC combines historical data with real-time predictive models. This fusion enables manufacturers to not only identify issues as they arise but also forecast potential anomalies before they occur.
Real-time Predictive Models
Prediction Control Charts are designed to accommodate dynamic, non-linear processes, making them highly adaptable to modern manufacturing environments. Here's how they work:
- Data Collection and Integration: PCC starts by collecting vast amounts of data from sensors, IoT devices, and other sources across the production line. This data is integrated and cleansed to create a comprehensive dataset.
- Machine Learning Algorithms: Advanced machine learning algorithms are then applied to this dataset to build predictive models. These models can anticipate how the process should behave under normal conditions.
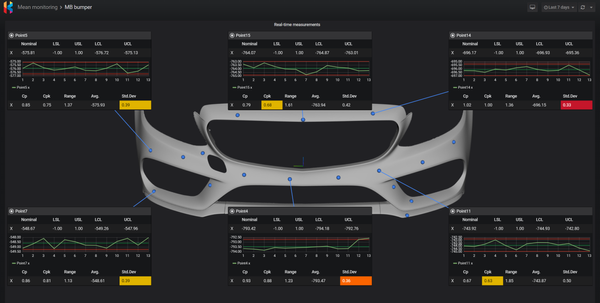
- Real-time Monitoring: As the manufacturing process unfolds, PCC continuously compares the real-time data with the predictions generated by the models. Any deviations from the expected behavior trigger alerts.
- Early Anomaly Detection: PCC excels at early anomaly detection. By identifying subtle deviations from predicted patterns, it allows manufacturers to take corrective action before defects or quality issues escalate.
Beyond Traditional SPC
One of the standout features of Prediction Control Charts is their flexibility:
- Adaptive Learning: PCC models can adapt to changes in the manufacturing environment. This means they remain effective even as processes evolve or new variables are introduced.
- Multivariate Analysis: PCC can handle multivariate data with ease. This is crucial in industries where various factors influence product quality simultaneously.
- Reduced False Alarms: Traditional SPC charts often produce false alarms, leading to unnecessary downtime and resource allocation. PCC's predictive capabilities significantly reduce these false positives.
The good
The adoption of Prediction Control Charts yields numerous advantages for manufacturers:
- Improved Quality: By identifying issues early and proactively, PCC helps improve product quality and reduce defects.
- Increased Efficiency: Minimizing downtime due to unexpected issues translates to increased efficiency and productivity.
- Cost Savings: Reduced waste, fewer rework requirements, and improved resource allocation lead to significant cost savings.
- Enhanced Decision-Making: PCC provides actionable insights, allowing manufacturers to make data-driven decisions and continuously optimize processes.
The bad
While Prediction Control Charts offer immense promise, they are not without challenges. These include the need for robust data infrastructure, ongoing model maintenance, and skilled personnel for implementation and interpretation. However, the benefits far outweigh the challenges, making PCC a worthy investment for forward-thinking manufacturers.
Conclusion
Prediction Control Charts offer a flexible, AI-driven approach to Statistical Process Control that empowers manufacturers to achieve higher quality, efficiency, and cost savings. As the manufacturing industry evolves, embracing this new but complicated tool will be key to staying competitive and ensuring the highest standards of product quality.
Al revisar camisetas de fútbol para entrenar, conviene empezar por la temporada, el diseño y los detalles visibles. Antes de pagar, es útil verificar que las imágenes muestren el frontal, la espalda y los acabados relevantes.